

“Making money slowly is much better than making—then losing— money quickly.”– David Booth
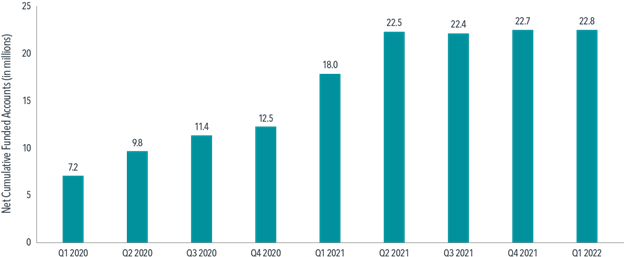
As the pandemic dragged on, many people’s hobbies included baking sourdough bread, binge watching Tiger King, and day trading certain meme stocks. With “stimmies” (stimulus checks) in hand, commission-free trading platforms widely available, and an abundance of time to spare, retail investors opened brokerage accounts and downloaded trading apps in droves. For example, new Robinhood accounts (see Exhibit 1) more than tripled from the start of the pandemic through March 2022.
Exhibit 1
Retail Therapy
Number of funded Robinhood accounts, Q1 2020–Q1 2022
Some of these new investors dove into the market for entertainment purposes and potential riches, but many soured after experiencing the reality roller coaster of short-term trading. While it can be difficult to tune out the “get rich quick” hysteria, doing so may save investors—and their financial goals—from being taken on a wild ride. The potentially smoother journey that diversification offers may be less entertaining on the way up, but it generally makes for a better experience than leaving investment goals to chance.
Case Study
Part of the meme frenzy of sending certain stocks “to the moon! 🚀🌙” relies on what members of the meme-stock community call “diamond hands 💎🤲”—which refers to investors holding onto a stock, despite the pressure of heavy losses, because they have conviction the stock price will rise again. Conversely, “paper hands 🧻🤲” is an insult hurled at investors who are perceived as weak because they exited a stock position too early.
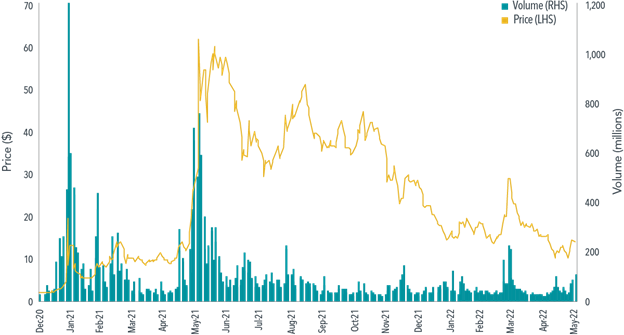
Infamous meme stock AMC Entertainment Holdings Inc. (see Exhibit 2) serves as an example of how investors’ experiences with the same security can be dramatically different. There are many ways this story played out, but based on trading volumes and volatility as catalysts for the actions of hypothetical investors, we compare the journeys of a hypothetical “Paper Hands 🧻🤲” investor versus a “Diamond Hands 💎🤲” one. Both bought AMC on January 27, 2021, when the stock hit a record trading volume of 1.2 million shares and closed at $19.90 per share. Paper Hands 🧻🤲 then sold a few months later, on the second-highest trading-volume day, at the all-time-high closing price of $62.55. Paper Hands 🧻🤲 happened to be one of the “get rich quick” success stories with an investment that tripled in a few short months. Diamond Hands💎🤲, believing AMC was still en route to the moon! 🚀🌙, held on through wild swings, but after a tumultuous year finally let go and sold—down 19%. Meanwhile, over the same period, the Russell 3000 Index rose 18% and with far less volatility.
Exhibit 2
Cautionary Tale
Rise and fall of AMC Entertainment Holdings
Past performance is not a guarantee of future results.

Past performance is not a guarantee of future results. Performance results are hypothetical and achieved with the benefit of hindsight. Indices are not available for direct investment; therefore, their performance does not reflect the expenses associated with the management of an actual portfolio.
Our toy case study of AMC uses the benefit of hindsight to show how, even if someone boards the right meme-stock rocket ship relatively early, riches are not guaranteed. The hypothetical investor must also decide when to step off the ride, which is easier in theory than in practice.
“Only about a quarter of stocks that rocketed 200% or more went on to subsequently outperform the market through May 2022.”
To have the chance of striking it rich on a single stock, you must pick the right one before it goes up. Of the roughly 3,000 names in the Russell 3000 Index, less than 2% (46 names) rose 200% or more over the course of any two-week period from March 2020 through May 2022. Some of these names were notable meme stocks such as AMC, Eastman Kodak Company, GameStop, and Workhorse Group Inc., each of which is down substantially from its high.
Exhibit 3
The Harder They Fall
Drawdowns of meme stocks

Past performance is not a guarantee of future results.
Suppose an investor was especially prescient or lucky and bought one of these 46 names two weeks before it notched the 200%-plus gain. Even including that unrealistic leg up, stock picking is a risky move. Approximately 30% of those stocks ended up underperforming the overall market (as represented by the Russell 3000 Index) through May 2022. Investors who bought in after the 200%-plus gain likely fared worse. Only about a quarter of stocks that rocketed 200% or more went on to subsequently outperform the market through May 2022.2 This asymmetric result isn’t surprising; research shows that relatively few individual stocks outperform the market. Holding a diversified portfolio with many names decreases the chances of a permanent loss and increases the chances of owning the big winners that drive market performance.
Even within our retrospective sample of stocks with very high short-term returns, market outperformance isn’t guaranteed. And, of course, without the benefit of hindsight, the odds are heavily stacked against the meme-stock investor. Chasing individual names in hopes of catching a meme-stock phenomenon may be tempting, but the data are clear that it’s a big gamble. Investors would be better off investing for the long term in diversified portfolios and spending time and effort on other hobbies picked up in the pandemic.
For those that want a better way to invest, keep these three principles in mind:
- Diversification has been called the only free lunch in investing
- Uncertainty is part of investing
- Investments should be aligned with goals
- In internet slang, stonks is a deliberate misspelling of stocks, as traded in the stock market. It is often used to refer to such stocks—and finance more generally—in a humorous or ironic way, especially to comment on extreme outcomes.
- Each of the 46 stocks’ returns were calculated two-weeks before their 200% gain vs the Russell 3000 and the two weeks immediately after their 200% gain vs the Russell 3000 (when most meme investors would have bought in), both through May 2022.
The original version of this article has been reprinted with permission. This content is developed from sources believed to be providing accurate information and provided by Dimensional Fund Advisors. Please consult legal, finance or tax professionals for specific information regarding your individual situation. The opinions expressed and material provided are for general information and should not be considered a solicitation for the purchase or sale of any security.